Now that the market has pulled back, investors may be looking for entries into stocks that where rallying before the volatility hit.
This post will consider some potential names, using TradeStation’s powerful scanning tools and information from Market Insights.
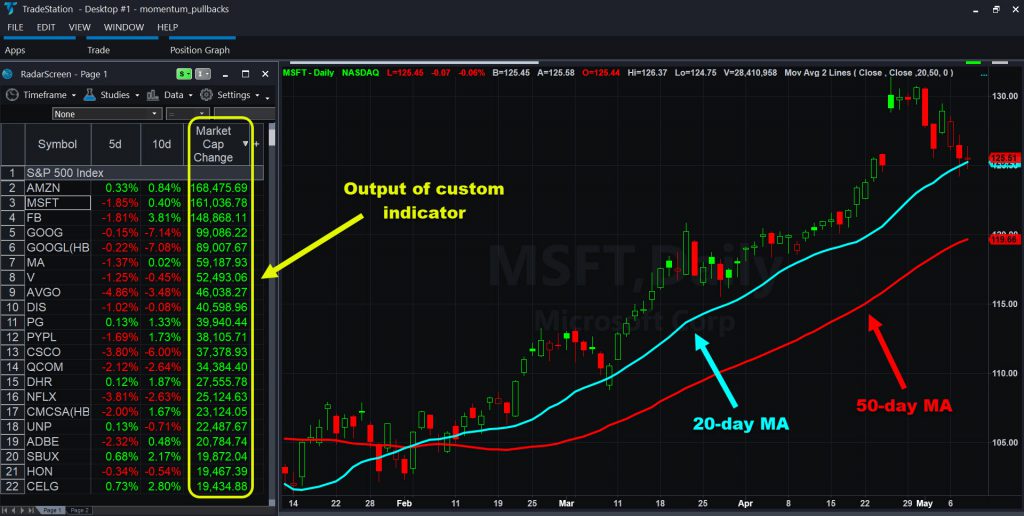
Microsoft (MSFT) tops the list after retracing a gap higher on strong earnings. It appeared under both the scanning methods outlined in this post.

Broadcom (AVGO) met one of the criteria — having a short-term decline after a longer-term gain. The semiconductor maker was one of the big winners last earnings season, shooting to new record highs on strong results. A successful shift to the fast-growing data-center market (rather than smart phones) fueled the beat.
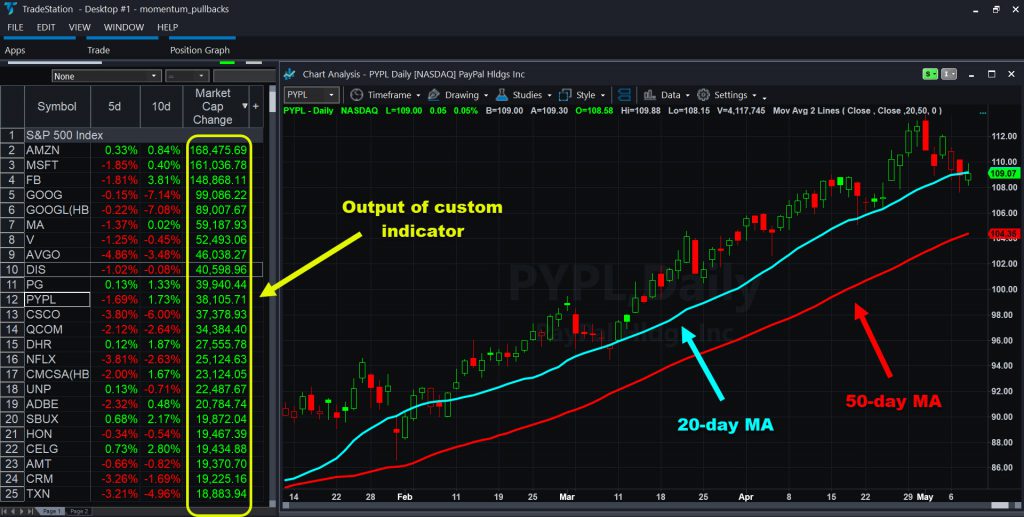
PayPal (PYPL) is in a similar situation two weeks after rallying on its earnings report. It was detected by both of our scans.
Defining the Searches
Here are the two basic searches we used:
- Find stocks that have appreciated “a lot” in the last six months that are down in the last week. By definition, these are pullbacks.
- Find stocks that have returned to a key moving average like the 50-day MA.
For No. 1, you obviously will ask for a definition of “a lot.” We could use a simple percentage return, but that inevitably grabs small and obscure companies that skyrocketed on thin volume.
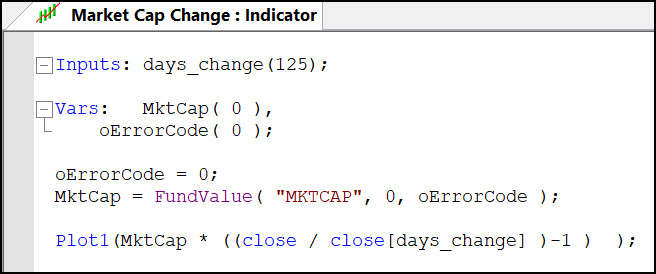
This problem can be solved by using market capitalization. Check out this custom indicator using a few lines of Easy Language:

Don’t let this code scare you. It does four things simple things.
First, it accepts a time period called days_change. Its default is 125 trading sessions, or roughly six months. It then defines two variables needed in the next section.
Its third step is to grab market capitalization from TradeStation’s deep library of fundamental data. (The FundValue command). Finally, the Plot1 line calculates and outputs the change.
This shows how much market capitalization a company has gained or lost over a certain time frame. We then added it to RadarScreen® and imported the entire S&P 500 index. Shorter time frame indicators highlight stocks down a lot in the last week or two. Voila, pullbacks in major blue-chip stocks appear.

Pullbacks to Moving Averages
Another way to detect potential pullback opportunities is to find stocks in contact with a moving average.
This time we created another indicator that does the following:
- Calculate the moving average, like the 50- or 20-day.
- Determine whether it’s rising or falling.
- Tell the user if it’s being tested in the current day.
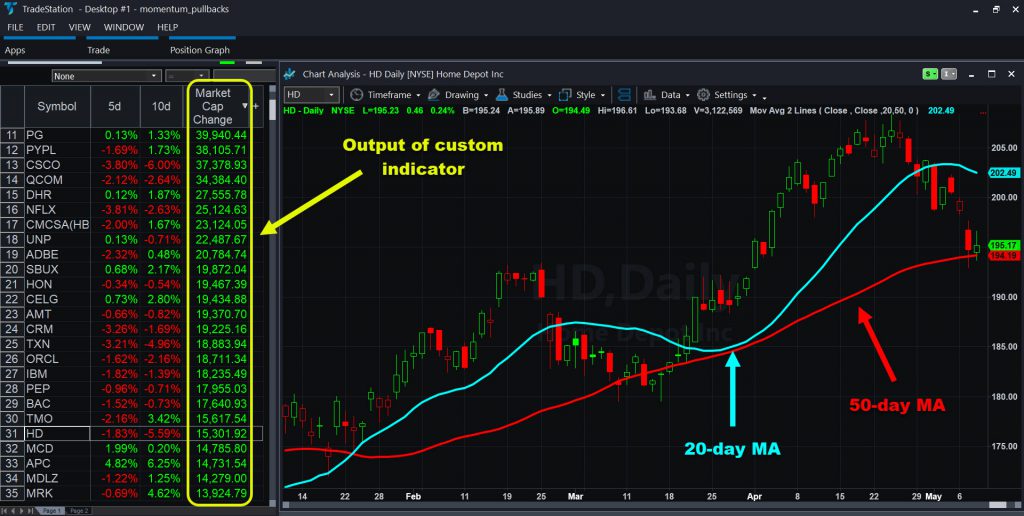
Home Depot (HD) was a big name with a pullback to its 50-day moving average. The home-improvement chain had a quick turnaround after profit missed estimates in February. Have investors priced in a rebound in construction since then? We’ll find out with the next set of numbers on May 21.

Credit-card giants Mastercard (MA) and Visa (V) surfaced when we adjusted this parameters for pullbacks to the 20-day moving average. This same scan also spotted MSFT, Apple (AAPL) PYPL, MSFT and software company Twilio (TWLO) — to also name a few well known stocks.
Always Prepared
The market invariably goes through periods of complacency and volatility. Some of the best opportunities come during the volatility, like we saw early this week.
The trouble is that it’s hard to think clearly during a selloff because stocks are tanking. You may be scared as emotions run high. That’s why investors should consider having tools ready for moments like Monday and Tuesday. Fortunately, TradeStation can be a big help when the fear sweeps the market.
In conclusion, “wait for pullbacks” is one of the most basic principles in trading. It’s often easier said than done. Hopefully this post helps you see how the platform can do a lot of the work for you.


