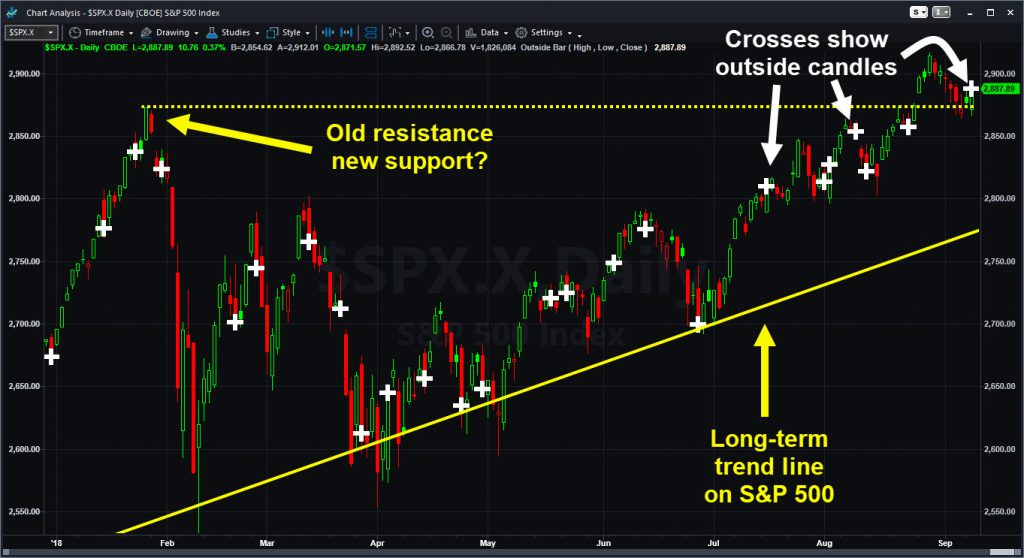
Something interesting happened yesterday: a bullish engulfing candle on the S&P 500.
That means the index opened below the previous session’s low and closed above its high. It’s a classic reversal pattern that may signal a directional change. In this case, it could prove bullish because price declined in the preceding 7-8 days.
Technicians may find something else positive because the bounce occurred at the same 2873 level where the S&P 500 peaked on January 26. Including Friday, September 7, it was the second time that old resistance level provided support. Activity like that is often viewed as consistent with an uptrend. Will buyers come out of the woodwork if they come to believe there won’t be a deeper pullback?

The Nasdaq-100 and S&P 400 midcap index also had “outside days,” another potential reversal pattern. (This time it involves a lower low and higher high rather than opening and closing prices.) Interestingly, the Dow Jones Transportation Average ($DJT) behaved similarly before breaking out on Monday.
Have you been watching the longer-term trend
line on the S&P 500? Click here for more.
Beyond just the charts, there seems to be more positive sentiment in the news. While Market Insights has beaten the drum about strong manufacturing trends and business investment for months, some of the big Wall Street firms (Goldman Sachs) and popular press (New York Times) have been catching up in the last two weeks.
There was also more validation yesterday as NFIB’s small-business index hit a record because of tax cuts and deregulation. Job openings continue to outnumber the unemployed and last week’s manufacturing data from the Institute for Supply Management spiked much more than expected to a 14-year high. All of this follows a strong corporate-earnings season.
Combine these headlines with the chart patterns. Throw in the apparent fact that some institutions have remained on the sidelines for most of the year. And a question emerges: Will investors, long uneasy about stocks, be forced to deploy cash and chase a rally as the American economy enters the homestretch into Thanksgiving and the holidays?
Disclosure: This post is intended for educational purposes and should not be considered a recommendation.


